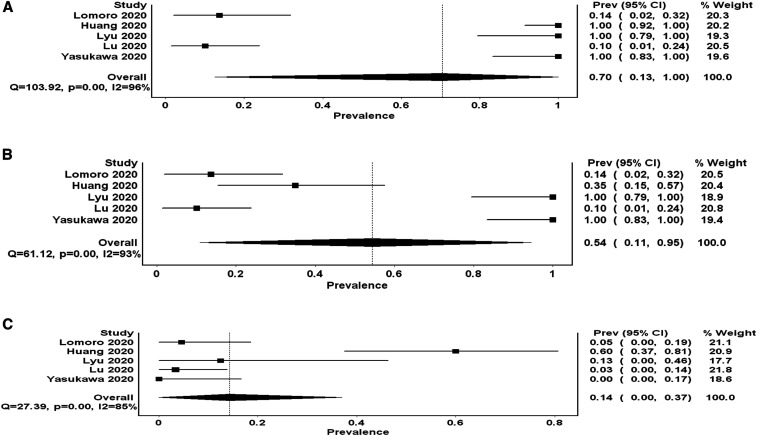
Figure 3.
Forest plot depicting (A) the pooled proportion of pleural line abnormalities (pleural thickening or irregularities, whichever is higher), (B) pleural thickening, and (C) pleural effusion detected by lung ultrasound in symptomatic COVID-19 patients. * There is a high heterogeneity depicted by extremely high I2 for all three abnormalities.

