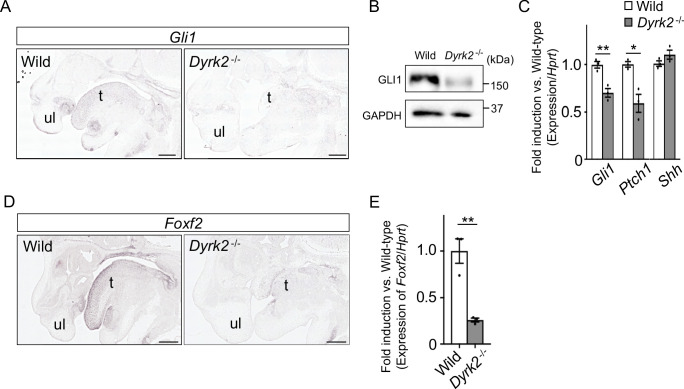
Figure 2. Deletion of DYRK2 affects activation of Hh signaling in mouse development.
(A) In situ hybridization of Gli1 in the craniofacial region in wild-type and Dyrk2-/- embryos from the sagittal plane at E14.5. (B) Immunoblotting of GLI1 in extracts from the limbs of wild-type and Dyrk2-/- embryos at E13.5. GAPDH serves as a loading control. (C) qPCR of Gli1, Ptch1, and Shh in the limbs from wild-type and Dyrk2-/- embryos at E13.5. (D, E) Repression of Foxf2-expression in the craniofacial region of Dyrk2-/- mice. (D) In situ hybridization of Foxf2 in the craniofacial region in wild-type and Dyrk2-/- embryos from the sagittal plane at E14.5. (E) qPCR of Foxf2 in the mandibular arch from wild-type and Dyrk2-/- embryos at E10.5. Hypoxanthine phosphoribosyltransferase (Hprt) in (C and E) was used as an internal standard, and fold change was calculated by comparing expression levels relative to those of wild-type. Data are presented as the means ± SEM (n = 3 biological replicates). The statistical significance between wild-type and Dyrk2-/- was determined by the Student’s t-test. (*) p<0.05, (**) p<0.01. t, tongue; ul, upper lip. Scale bars, 500 µm.


