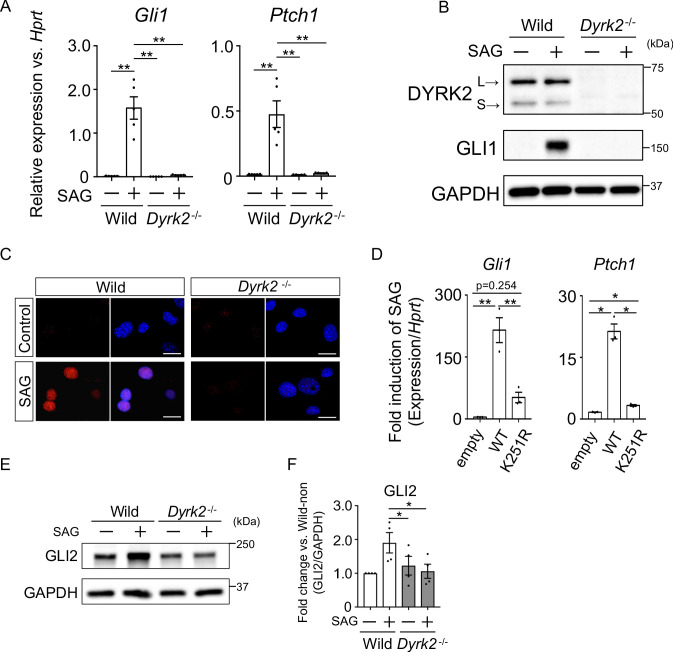
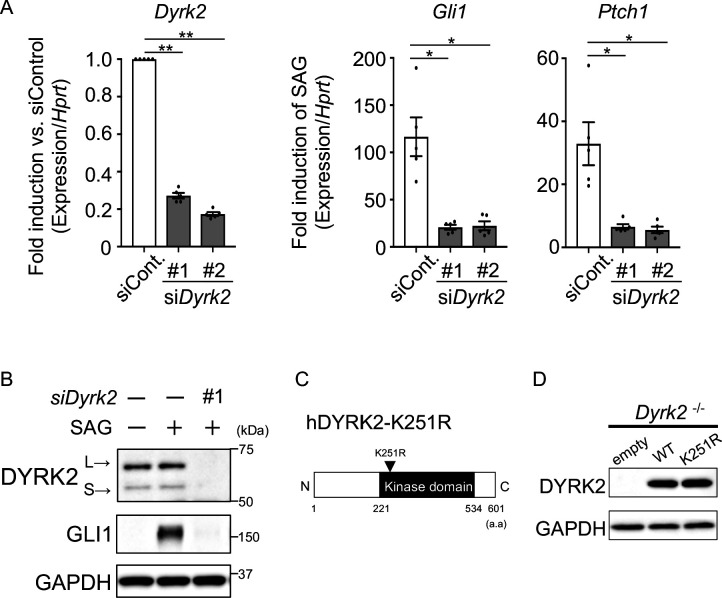
Figure 3. Deletion of Dyrk2 suppresses activation of Hh signaling in vitro.
(A) Expression of the Hh target genes Gli1 and Ptch1 in wild-type and Dyrk2-/- MEFs in the absence or presence of 100 nM SAG was measured by qPCR. Data are shown as relative expression to Hprt. (B) Protein levels of GLI1 and DYRK2 in wild-type and Dyrk2-/- MEFs in the absence or presence of 100 nM SAG were measured by immuno-blotting. L and S indicate long and short transcriptional isoforms of DYRK2, respectively. (C) Wild-type and Dyrk2-/- MEFs in the absence or presence of 100 nM SAG were immune-cytostained for GLI1 (red). Nuclei were stained with DAPI (blue). Scale bars, 5 µm. (D) Expression of Gli1 and Ptch1 in Dyrk2-/- MEFs overexpressing human DYRK2 or DYRK2-K251R (kinase dead) constructs via adenovirus infection was measured by qPCR. Data indicates fold induction of 100 nM SAG against vehicle after normalization to Hprt. (E, F) Immunoblotting for GLI2 in wild-type and Dyrk2-/- MEFs in the absence or presence of 100 nM SAG. Protein level as fold changes of GLI2 (E) was calculated by comparing protein levels relative to those of wild-type MEFs in the absence of SAG after normalization to the GAPDH loading control in (F). Data are presented as the means ± SEM (n = 5, 3, and 4 biological replicates per condition in A, D, and F, respectively). The statistical significance was determined by one-way ANOVA followed by Tukey’s multiple comparison test. (*) p<0.05, (**) p<0.01.


