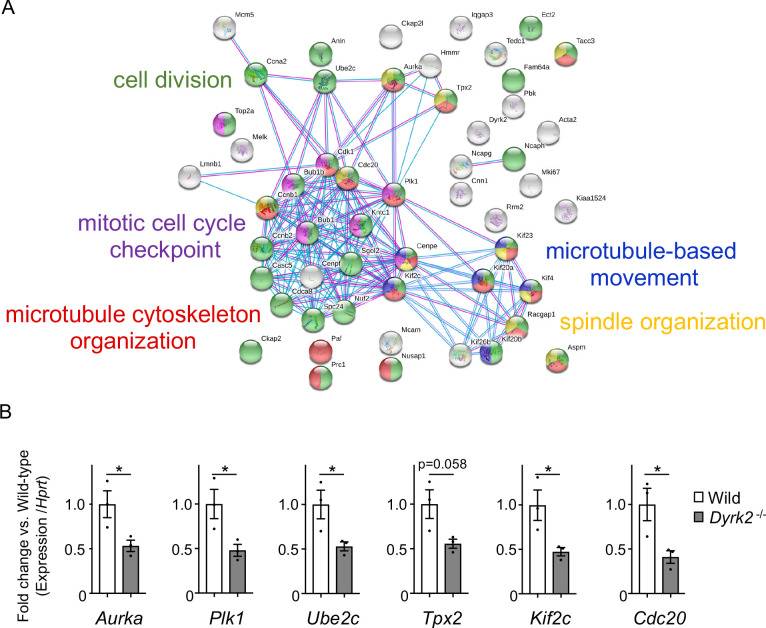
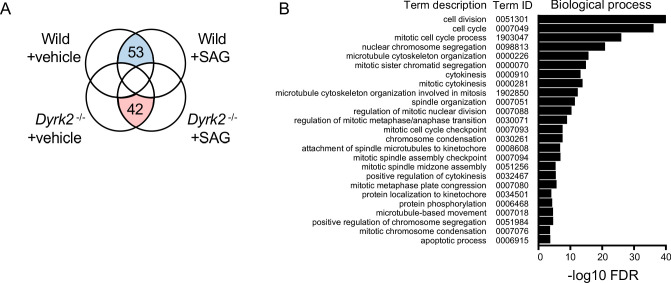
Figure 7. Changes in mRNA expression of genes in Dyrk2-/- MEFs.
(A) STRING GO analyses of the 53 differentially downregulated genes in Dyrk2-/- MEFs reveals protein-protein interaction networks. Robust networks for cell division (green, GO: 0051301), microtubule cytoskeleton organization (red, GO:0000226), spindle organization (yellow, GO:0007051), mitotic cell cycle checkpoint function (purple, GO:0007093), and microtubule-based movement (blue, GO:0007018) were extracted. (B) Confirmation of downregulation of genes related to ciliary resorption mechanisms in Dyrk2-/- MEFs by qPCR. Hprt was used as an internal standard, and fold change was calculated by comparing expression levels relative to those of wild-type. Data are presented as the means ± SEM (n = 3 biological replicates per condition). The statistical significance between wild-type and Dyrk2-/- MEFs was determined using the Student’s t-test. (*) p<0.05.


