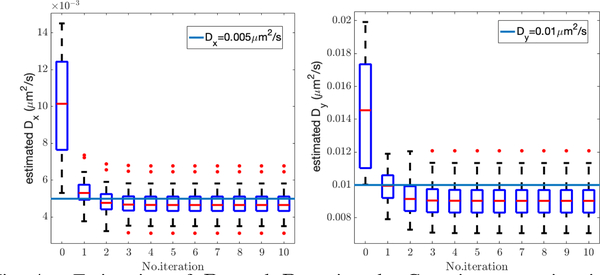
Fig. 4.
Estimation of Dx and Dy using the Gaussian approximation to the measurement model. As with all box plots, the (red) line in the box denotes the median, the edges of the box show the first and third quartiles, the vertical dashed lines indicate bounds of 1.5 times the interquartile range, and the red dots indicate outliers.

