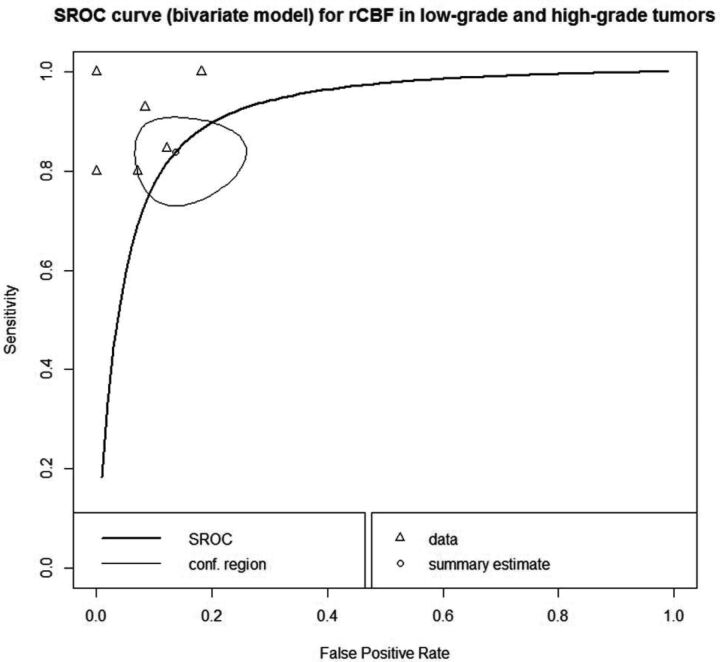
Fig 2.
Summary of the receiver operating characteristic curve (bivariate model) for the discrimination of low- and high-grade tumors by relative CBF. The curved line describes the variation in sensitivity and false-positive rate (1-specificity) across the data depicted by open triangles and the open circle, indicating the summary estimate surrounded by the confidence region illustrated by the thinner black line. The area under the curve was 0.92. SROC indicates summary receiver operating characteristic; conf, confidence.

