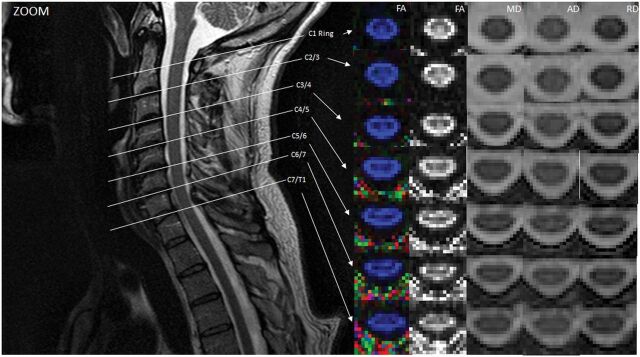
Fig 4.
Illustration of DTI indices at different spinal cord levels localized by a T2-weighted image in ZOOM. Midsagittal T2-weighted image shows the location of the 7 axial diffusion tensor images that cover the entire length of the cervical spinal cord. Color and gray-scale FA maps are in the first and second columns. MD, AD, and RD maps at each location are also shown. Note that spatial resolution is improved and distortion is lower compared with the non-ZOOM acquisition (Fig 5). ssEPI indicates single-shot EPI.

