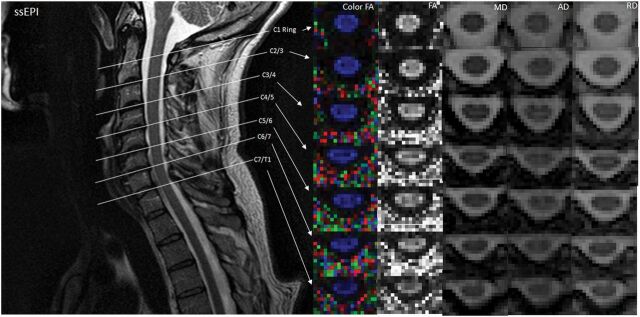
Fig 5.
Illustration of DTI indices at different spinal cord levels localized by a T2-weighted image in non-ZOOM. Midsagittal T2-weighted image shows the location of the 7 axial diffusion tensor images that cover the entire length of the cervical spinal cord. Color and gray-scale FA maps are in the first and second columns. MD, AD, and RD maps at each location are also shown.

