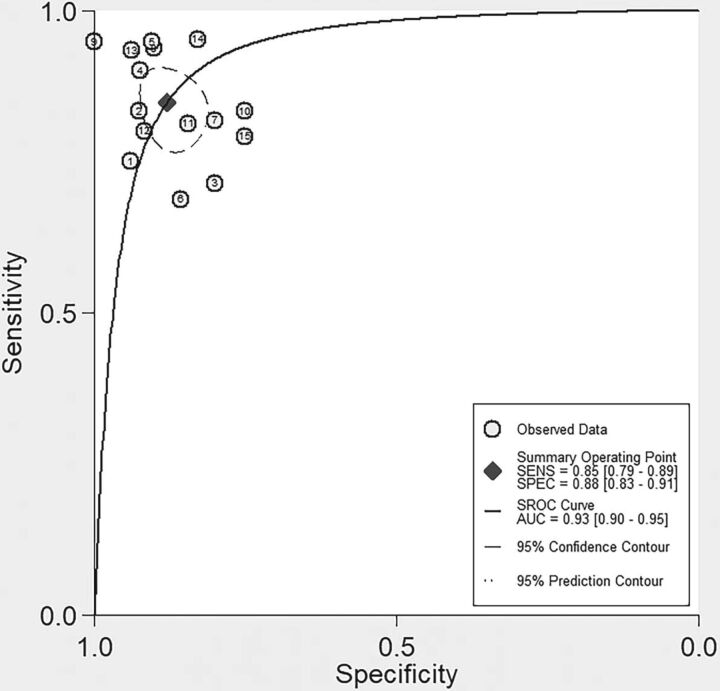
Fig 3.
Summary receiver operating characteristic curve of PET. Each circle indicates 1 included study, and the size of the circle indicates the weight of that study. The summary point (♦) indicates an estimate of sensitivity and specificity, with the dashed line representing the 95% confidence region and the dotted line representing the 95% prediction region.

