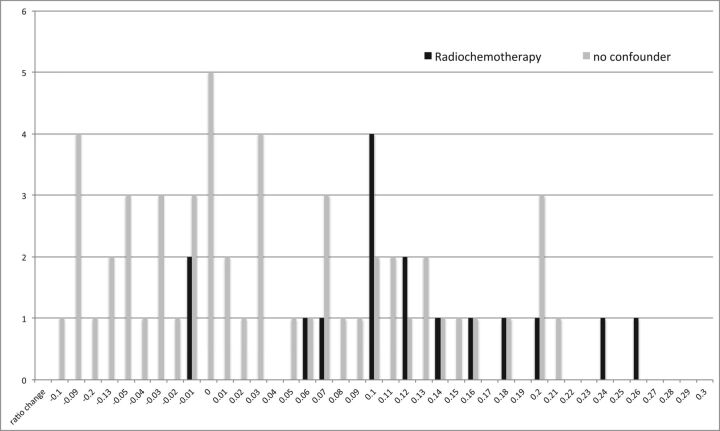
Fig 4.
Distribution of the signal ratio change of the globus pallidus compared with the thalamus (globus pallidus to thalamus) in children with no treatment variables (gray bars) and children with radiochemotherapy (black bars) shows a shift/tendency to higher ratio changes in children with posterior fossa tumors under therapy.

