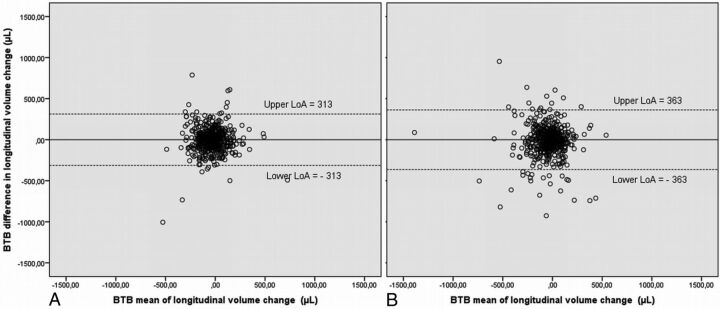
Fig 3.
Bland-Altman plots for the left caudate nucleus, presented for the outcome measures of BTB difference in longitudinal volume change, to illustrate agreement for A, FreeSurfer and B, FIRST. Plots show the difference between the 2 measurements (ie, the “BTB difference”) along the vertical axis versus the mean of the 2 measurements along the horizontal axis. LoAs for FreeSurfer are obviously smaller (ie, better reproducibility) than those of FIRST.

