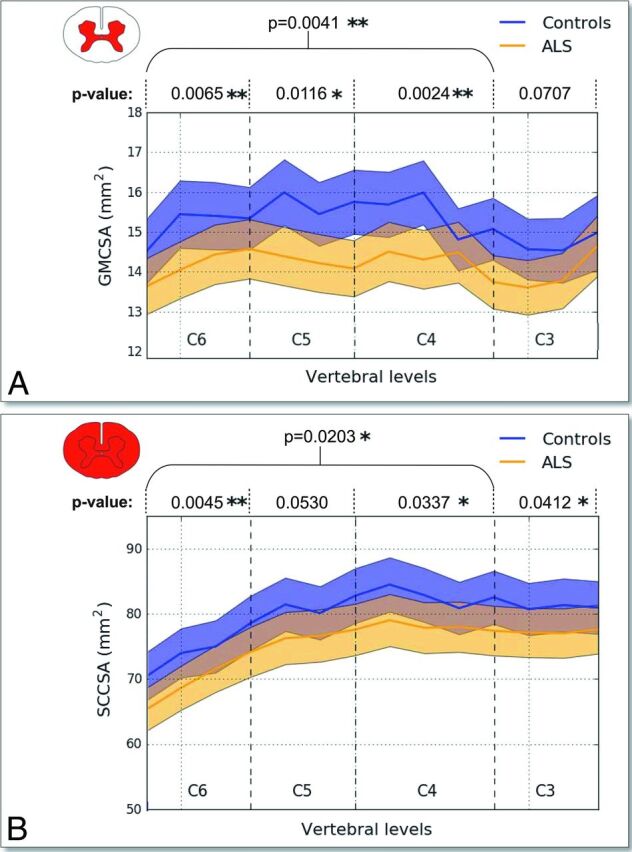
Fig 3.

GMCSA and SCCSA measured on controls and patients with ALS between the C6–C3 vertebral levels. GMCSA (A) and SCCSA (B) averaged within group and plot against the cervical SC axis. Overall, a stronger intergroup difference can be observed for GMCSA. Asterisk (P ≤ .05) and double asterisk (P ≤ .01) at specific vertebral levels indicate significant differences between patients with ALS and controls according to Student t test P values representing control-to-patient differences in GMCSA and SCCSA for each cervical level between C6 and C3 and across levels.
