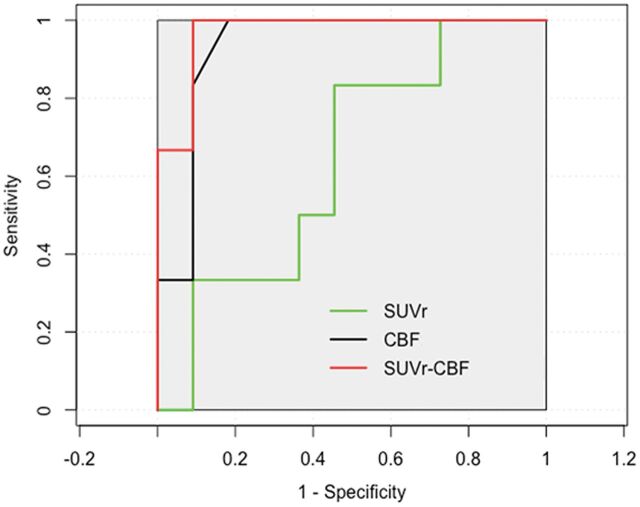
Fig 1.
Receiver operating characteristic curves for SUVr, CBF, and combined SUVr and CBF to predict EZ. The combined PET and ASL obtain the highest area under the curve (0.970) with high sensitivity (100%) and specificity (90.9%). PET has more diagnostic information with an area under the curve of 0.926, compared with ASL (area under the curve of 0.679). The combined PET and ASL show the best performance in specificity for predicating EZ.

