Fig 6.

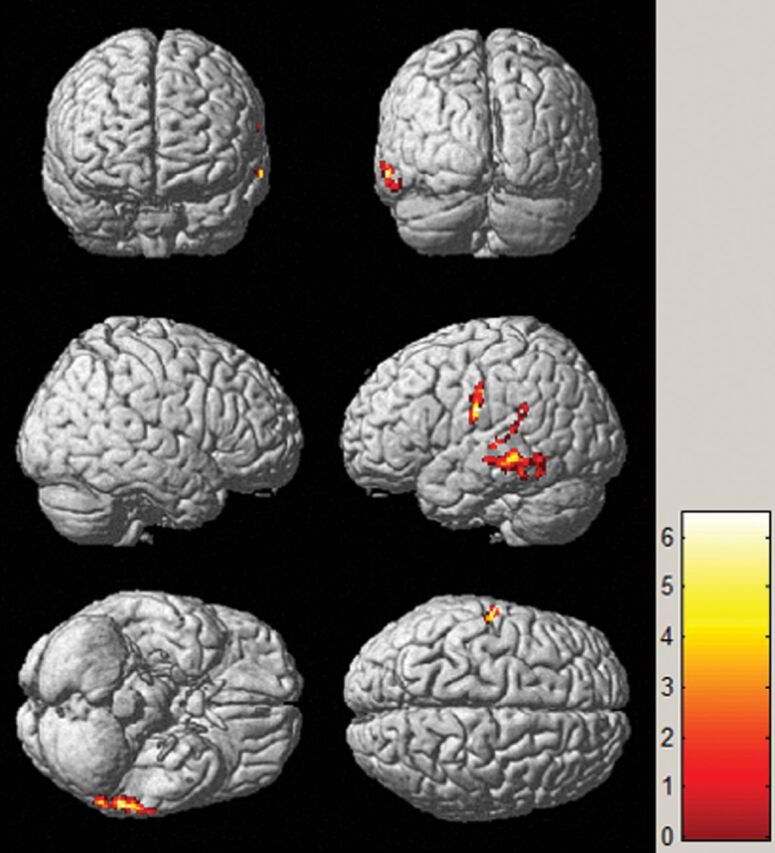
SPM analysis of [18F] FDG-PET images in localizing the EZ between patients and healthy controls. The hypometabolic region is mainly identified in the middle temporal gyrus. The threshold P value is set at .001.

SPM analysis of [18F] FDG-PET images in localizing the EZ between patients and healthy controls. The hypometabolic region is mainly identified in the middle temporal gyrus. The threshold P value is set at .001.