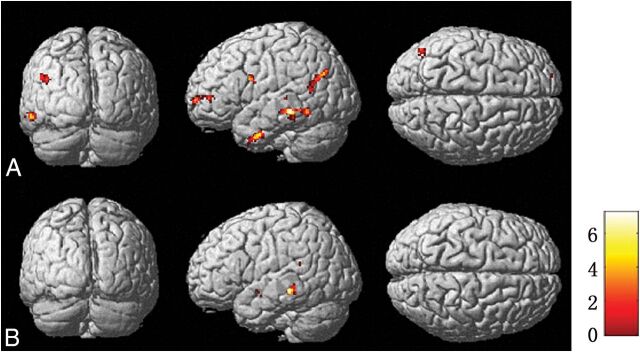
Fig 7.
Brain regions of metabolism and perfusion asymmetry of patients compared with controls by SPM analysis in PET (A) and ASL images (B), respectively. The regions of metabolism and perfusion asymmetry are mainly identified in the middle temporal gyrus and superior temporal gyrus, respectively. The threshold P value is set at .001.

