
Fig 3.
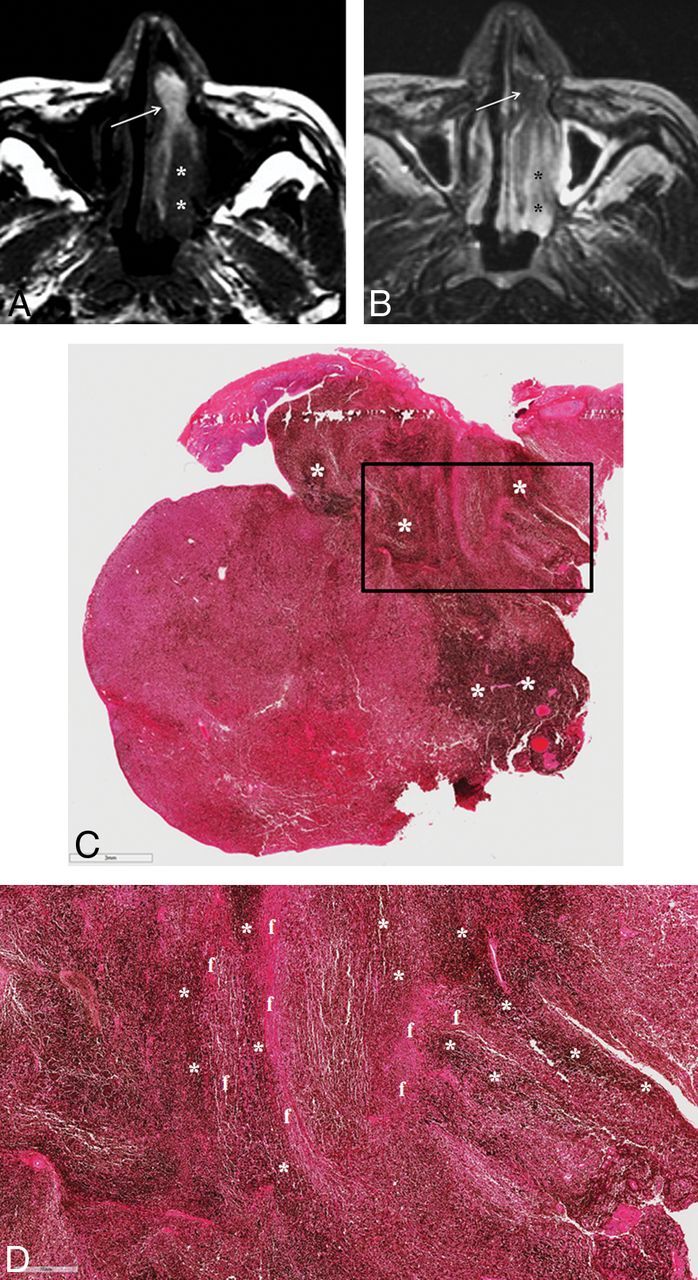
SNM displaying a partial T1-SP. A, Precontrast axial T1WI demonstrates an elongated mass with heterogeneous signal intensity in the left nasal cavity. While the anterior portion of the mass shows the alternating hyperintense and hypointense bands, the so-called T1-SP (arrow), the posterior portion is the soft-tissue component with the signal intensity isointense to the brain stem (asterisks). B, On fat-suppressed axial T2WI, the anterior portion of the mass appears isointense to the brain stem (arrow), while the posterior portion becomes hyperintense (asterisks). Insufficient facial and buccal fat suppression was caused by magnetic field inhomogeneity due to metallic dental hardware. C. Photomicrograph reveals an uneven distribution of melanin pigments (dark bands marked with asterisks). The bar on the left bottom indicates 3 mm (hematoxylin-eosin, original magnification ×7). D, Photomicrograph with higher magnification corresponding to the box in C shows the area of the alternating melanin (dark bands marked with asterisks) and fibrous (f) bands. The bar on the left bottom indicates 700 μm (hematoxylin-eosin, original magnification ×30).