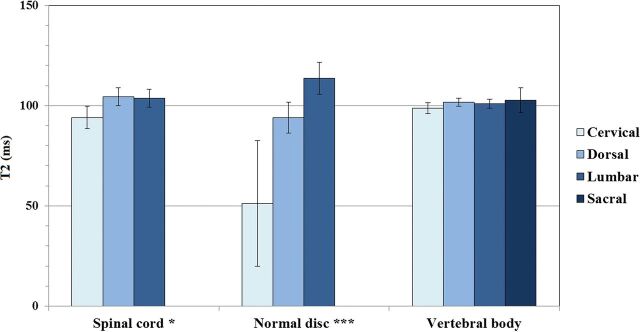
Fig 4.
ANOVA results with comparison of estimated marginal means of T2 values for spinal cord, normal discs, and vertebral bodies across spinal levels, assuming fixed ages of 56.2, 37.2, and 56.4 years, respectively (single asterisk indicates P < .05; double asterisks, P < .01; triple asterisks, P < .001). Significant pair-wise differences between spinal levels are indicated by a different letter assigned to each level.

