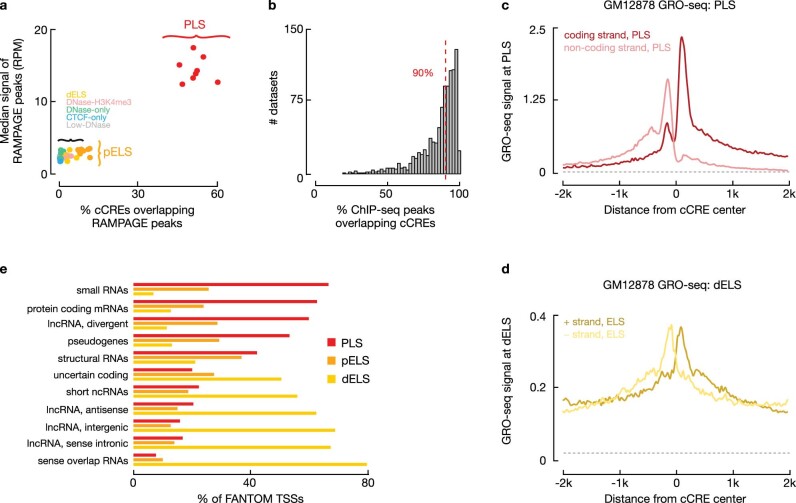
Extended Data Fig. 3. Summary of transcription and transcription factor binding at cCREs.
a, Scatterplot depicting percent overlap of various groups of cCREs with RAMPAGE peaks in eight biosamples with matching data vs. the median expression level (in RPM) of the overlapping RAMPAGE peaks. b, The vast majority of high-quality ChIP–seq peaks of chromatin-associated proteins (mostly transcription factors) overlap cell type-agnostic cCREs. The median overlap is 90% across all ChIP–seq experiments. c, d, GRO-seq signal in GM12878 averaged over all cCRE-PLSs (c, in red) and cCRE-dELSs (d, in yellow) in a ± 2 kb window around cCRE centres. The GRO-seq signals around cCRE-PLSs were grouped by the orientation of their associated genes. The GRO-seq signals around cCRE-dELSs were grouped by genomic strands. Genomic background signal, computed as described in Supplementary Methods, is shown by the grey dashed lines and was approximately 0.02 for both strands in GM12878. e, Percentages of the transcription start sites of FANTOM CAGE-associated transcripts in the eleven FANTOM-defined categories that overlap cCRE-PLSs (red), cCRE-pELSs (orange), or cCRE-dELSs (yellow). The TSSs of the majority of coding-associated transcripts (protein-coding mRNA and divergent lncRNAs) overlapped a cCRE-PLS, while the TSSs of the majority of eRNA-like noncoding RNAs (short ncRNAs, antisense lncRNAs, intergenic lncRNAs, sense intronic lncRNAs, and sense overlap RNAs) overlapped a cCRE-dELS.

