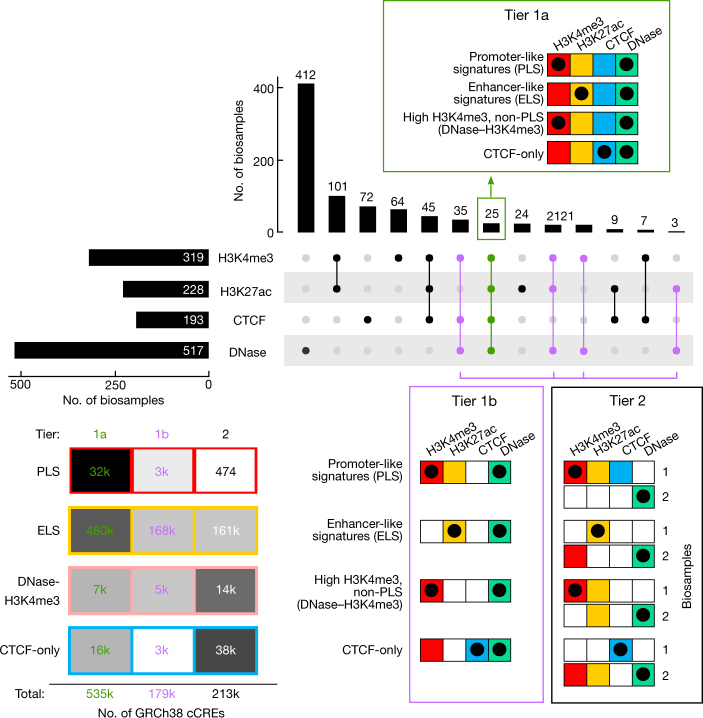
Box 1 Fig. 2 | Profiles of feature ascertainment across biosamples and confidence tiers for cCREs.
Top, upset plot showing the numbers of biosamples with the set of feature determinations indicated below the plot. Group and tier assignments are shown by matrices of feature determination and an indication of whether a high signal was observed, using conventions defined in Box 1 Fig. 1. The matrix for tier 1a is within the upset plot, and those for tiers 1b and 2 are below the plot. Assessment of tier 2 requires examination of data for two biosamples, indicated to the right of the matrices. The heatmap in the lower left shows the numbers of cCREs in each group and tier.

