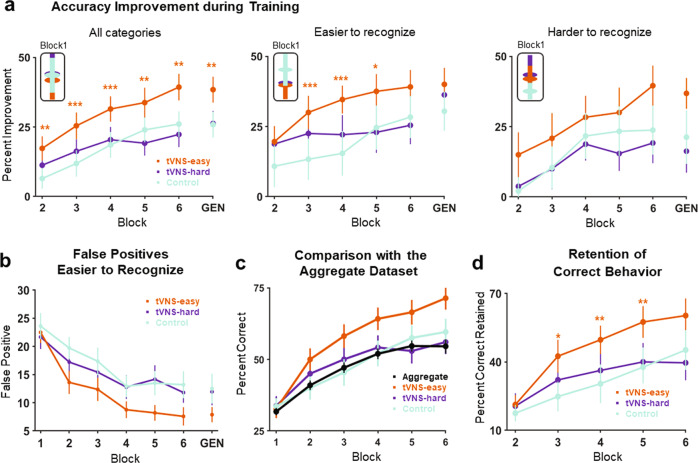
Fig. 2. Behavioral results.
a Left. Percent accuracy improvement (M and SEM) over Block 1 across subjects and categories for each participant group; the Generalization block (Block 7) is denoted as “GEN”. Middle-Right. Percent accuracy improvement (M and SEM) over Block 1 for easier-to-learn (middle) and harder-to-learn (right) categories. The asterisks denote statistical differences for group-by-block interactions (Control group, Block 1 = reference levels) in the following mixed-effects model: response outcome ~ group*block + (1 | subject) + (1 | tone category). b Percentage of false positives for Tone 1 and Tone 3 (M and SEM) by group and block. c Percentage of correct responses across subjects and categories for each participant group (M and SEM) and the Aggregate learning dataset, consisting of 678 comparable learners receiving no stimulation (M and 99% CI to compensate for the large sample size). d Percent of correct trials that were retained from the previous block.

