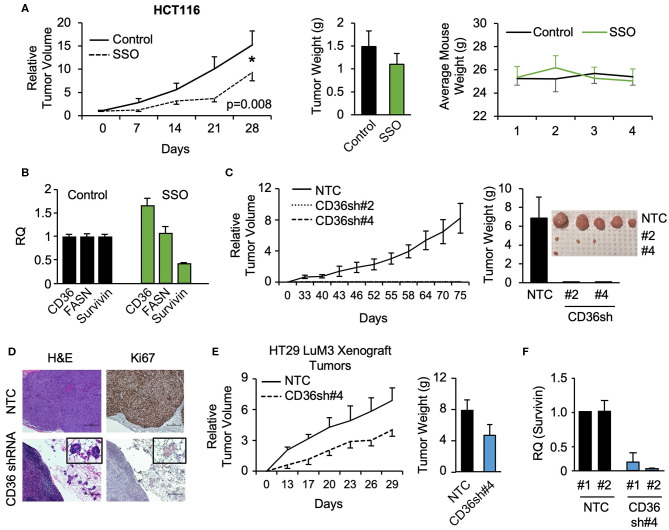
Figure 4.
SSO treatment and CD36 knockdown inhibit tumor growth in vivo. (A) Tumor volume, tumor weight, and mouse weight of control and SSO treated (20 mg/kg) mice are shown. SSO was dissolved in 10% PEG and administered in 200 μl dosages via oral gavage daily. 1.0 × 10⁶ cells were injected into NU/NU mice. Treatment was initiated when tumors reached ~100 mm3 (day 0). (B) RT-PCR analysis of HCT116 tumors showing the effect of SSO treatment on CD36, FASN, and survivin mRNA expression. (C) Tumor volume of HCT116 NTC and CD36 shRNA #2 and #4 xenografts is shown. 1.0 × 10⁶ cells were injected into NU/NU mice and tumor growth was measured every 3 days. (D) H&E and Ki67 staining of HCT116 NTC and CD36 shRNA tumors. (E) Tumor volume and tumor weight of HT29 LuM3 NTC and CD36 shRNA #4 xenografts are shown. (F) mRNA expression of survivin in HT29 LuM3 xenografts (analysis of tumors from 2 mice per group is show).

