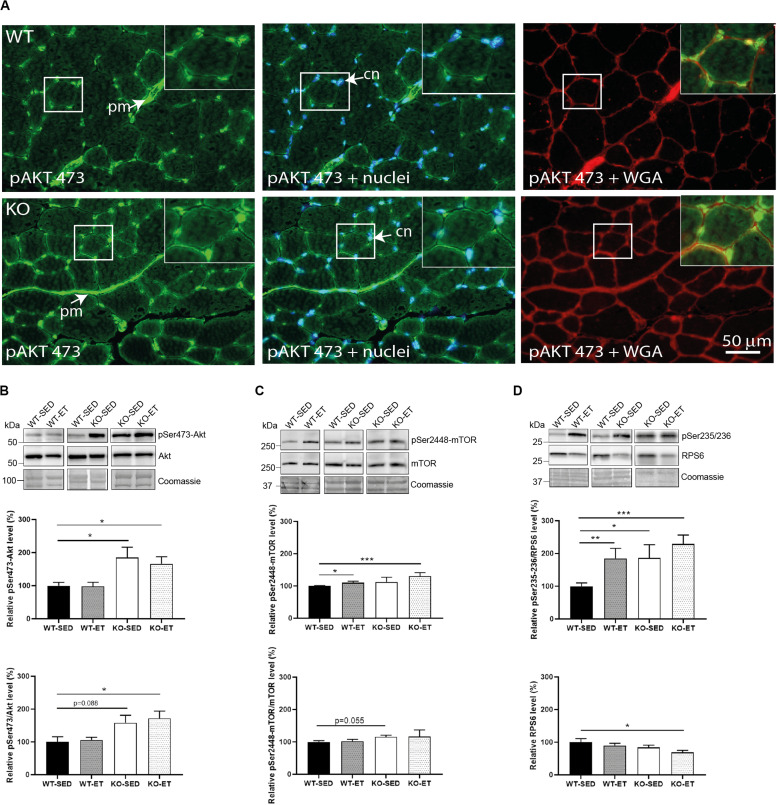
FIGURE 4.
The syndecan-4–/– muscle has an increased Akt/mTOR/S6K1 pathway. (A) Immunofluorescence of pSer473-Akt (green) in WT and syndecan-4–/– muscles. The cell nuclei were counterstained with Hoechst (blue). The connective tissue was stained with WGA (red). cn cell nuclei, pm perimysium, indicated with arrows. Inserts show magnification of boxed areas. Scalebar as indicated. Immunoblot analyses of (B) pSer473-Akt (upper panels) and Akt (middle panels), (C) pSer2448-mTOR (upper panels) and mTOR (middle panels), and (D) pSer235/236-RPS6 (upper panels) and RPS6 (middle panels) in WT-SED, WT-ET, KO-SED and KO-ET. The values are presented in percentage and are normalized to WT-SED (n = 6–10). Comparisons between the groups were analyzed using Mann–Whitney U test (*p < 0.05, **p < 0.01 and ***p < 0.001). ProBlue Safe Stain (Coomassie) was used as loading control (lower panels in B–D).

