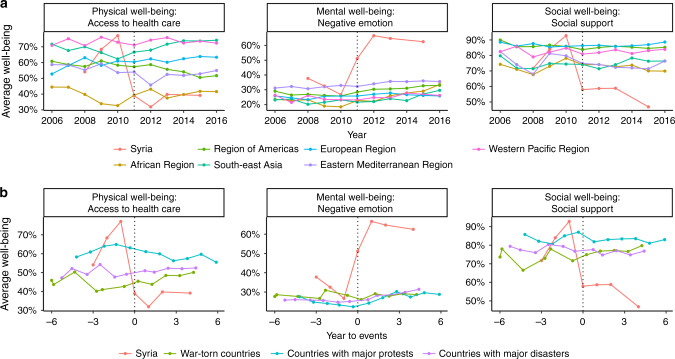
Fig. 3. Temporal comparisons in physical, mental and social well-being.
Panel a compares the changes in Syria to other World Health Organization (WHO) regions. Panel b compares Syria to other countries that experienced war, protests, and natural disasters. The dotted line indicates the start of events. SI Appendix, Supplementary Fig. 4 and Supplementary Table 10, presents the trends for all 13 indicators. This figure was created using R developed by the R Core Development Team (https://www.r-project.org/). Source data are provided as a Source Data file.

