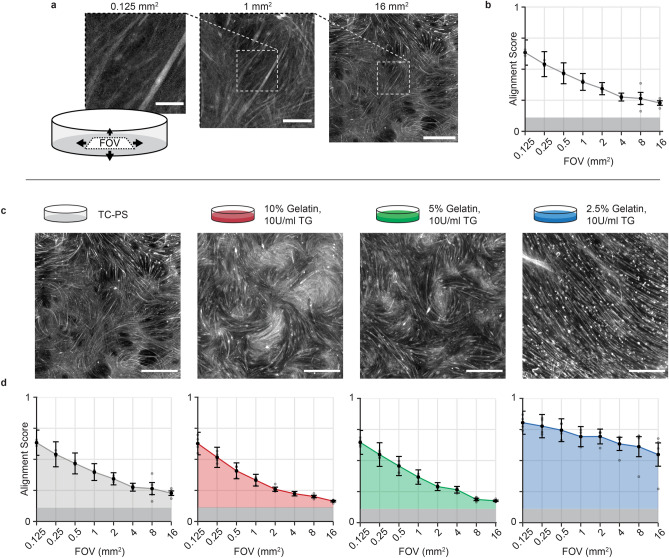
Figure 1.
Local and global spontaneous myotube alignment. C2C12 myoblasts were cultured on TC polystyrene and stained for F-actin after 9 days of differentiation. (a) Sample images (of n = 4) show that in conventional cell culture the degree of cellular alignment decreases with increasing field of view (FOV). Scale-bars: (left to right) 100 µm, 250 µm, 1 mm (b) Myotube alignment was quantified from F-actin images using the ImageJ Plug-in, OrientationJ, and given as an alignment score (0–1) for multiple FOVs ranging from 0.125 mm2 to 16 mm2. Areas shaded in dark grey indicate values below theoretical point of random alignment (0.11) for the analysis method (c) Large FOV images (16 mm2, scale bars = 1 mm) of C2C12 myotubes on various substrates at day 9 of differentiation. Left to right: TC polystyrene, 10% w/v gelatin—10 U/mL Transglutaminase (TG), 5% w/v gelatin—10 U/mL TG and 2.5% w/v gelatin—10 U/mL TG. (d) Alignment score as a function of FOV for C2C12 myotubes developed on various substrates. Left to right: TC polystyrene, 10% w/v gelatin—10 U/mL TG, 5% w/v gelatin—10 U/mL TG and 2.5% w/v gelatin—10 U/mL TG. Points indicate mean ± s.e.m. (n = 4). Evaluation performed on day 9 after initiation of differentiation.

