Figure 2.

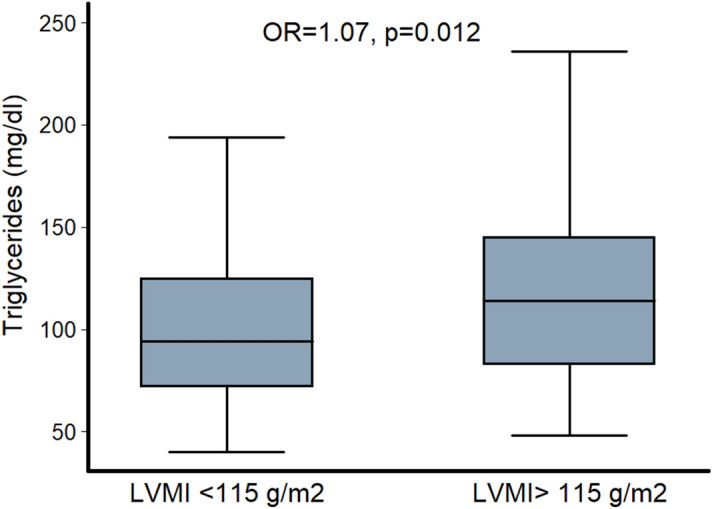
Difference in plasma TGs between hypertensive males with and without LV hypertrophy (LVMI below or above 115 g/m2). p-value was derived from logistic regression analysis after adjustment for age, SBP, plasma fasting glucose and smoking.

Difference in plasma TGs between hypertensive males with and without LV hypertrophy (LVMI below or above 115 g/m2). p-value was derived from logistic regression analysis after adjustment for age, SBP, plasma fasting glucose and smoking.