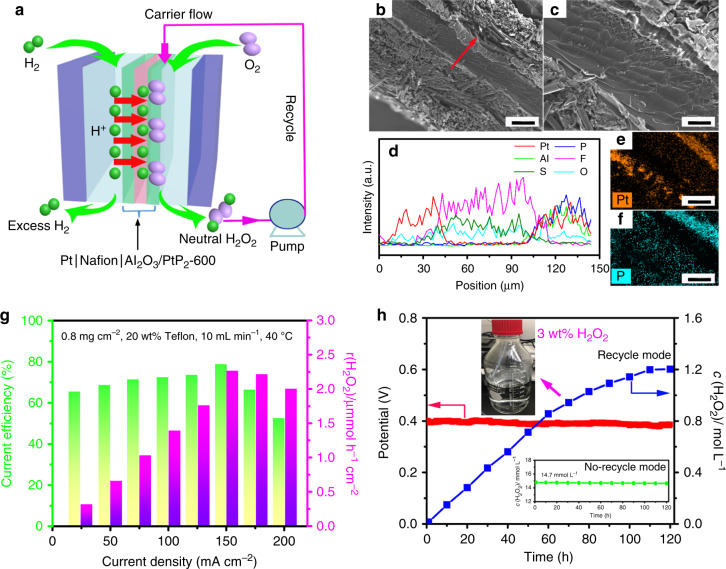
Fig. 5. Performance of polymer electrolyte membrane fuel cell (PEMFC).
a Schematic diagram of PEMFC for O2-to-H2O2 production with product recycling. b, c Cross-sectional SEM images; scale bar, b 100 µm; c 20 µm. d line-scan elemental distribution, and e, f elemental mapping of Al2O3/PtP2-600 based MEA; scale bar, 50 µm. g Current efficiency and H2O2 production rate as a function of current density under optimized conditions. h Time-dependent neutral H2O2 concentration measured at a constant potential of 0.4 for 120 h. The accumulated H2O2 concentration in 600 mL when the product is continuously cycled through the system. Concentration reaches a metric value of 3.0 wt% after 65 h (inset of Fig. 5h).

