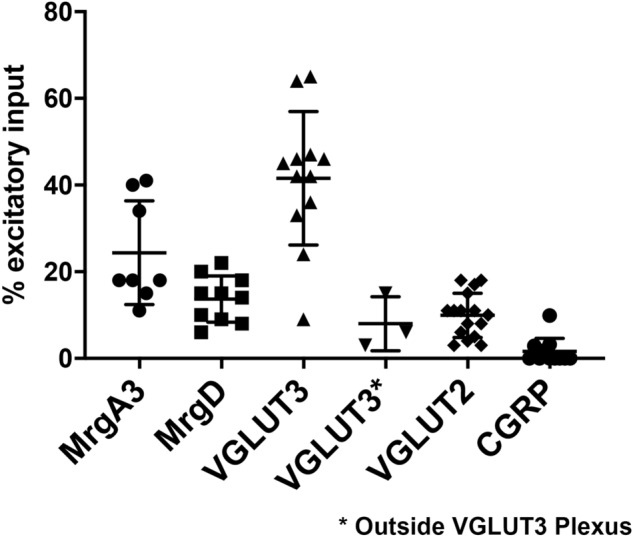
Figure 4.

The contribution of different types of glutamateric input to GRP-eGFP cells. Scatter plot showing the percentage of Homer puncta on these cells that were in contact with axons defined by the expression of different markers. For VGLUT3, we tested GRP-eGFP cells that had dendritic trees both within and outside the VGLUT3 plexus, and the latter are shown separately (VGLUT3*). The numbers of cells tested for each axonal population are shown in table S4. Each symbol represents an individual cell, and the mean and standard deviation are shown.
