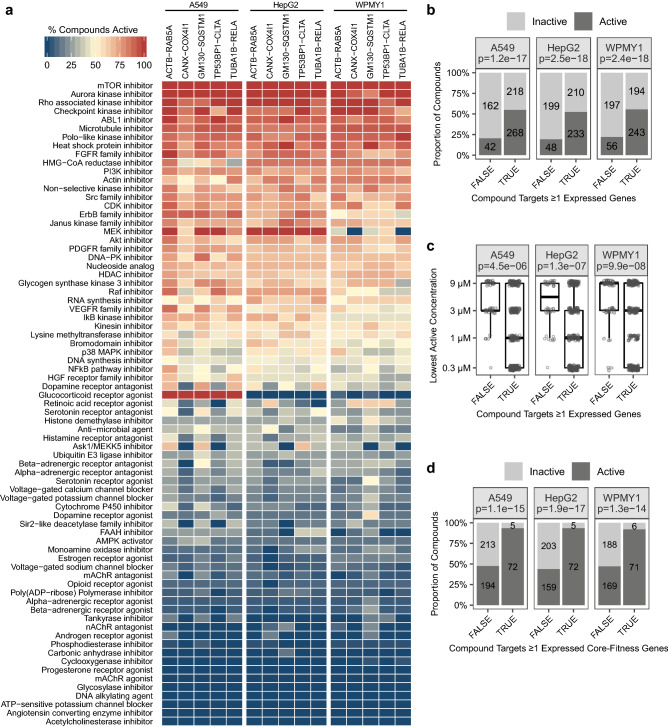
Figure 2.
Compounds annotated to expressed targets and core-fitness genes are more likely to have phenotypic activity. (a) Heat map showing the percentage of compounds that induced significant phenotypic activity for MoAs with ≥ 6 compounds tested (complete data in Supplementary Table S3). (b) Compounds annotated to expressed targets were more likely to be active than compounds annotated to targets that are not expressed. Target expression was determined using microarray data. Each dark-grey bar shows the number of compounds that are active in ≥ 1 of the five cell lines within each cell type; each light-grey bar shows the number of compounds that are not active in any of the five cell lines within each cell type. Fisher’s exact test p values are indicated below the cell type names in the header. (c) Active compounds annotated to expressed targets tended to be active at lower concentrations than active compounds annotated to targets that are not expressed. The vertical axis shows the lowest active concentration across the five cell lines within each cell type for each active compound. Wilcoxon rank sum test p values are indicated below the cell type names in the header. (d) Compounds that target core-fitness genes were more likely to be active than compounds that target non-core-fitness genes. Only compounds annotated to ≥ 1 expressed target were considered. As in (a), target expression was determined using microarray data. Each dark-grey bar shows the number of compounds that are active in ≥ 1 of the five cell lines within each cell type, and each light-grey bar shows the number of compounds that are not active in any of the five cell lines within each cell type. Fisher’s exact test p-values are indicated below the cell type names in the header.

