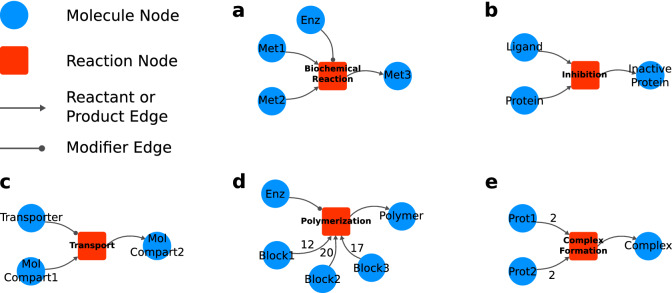
Figure 1.
Graphical representation of the reaction modeling framework. Molecule nodes are represented by blue circles. Red squares represent reaction nodes. Arrow-ended edges indicate reactant or product relationships depending on direction. Circle-ended edges indicate modifiers to the reaction. Some modeling examples of distinct kinds of biochemical interactions are depicted as follows. (a) A biochemical reaction ; (b) inhibition of a protein by a ligand; (c) molecular transport from compartment 1 to compartment 2 by a transporter; (d) a polymerization reaction; (e) a tetrameric protein complex formation. All detailed network visualizations in this and further Figures were generated using Cytoscape43.

