Figure 7.
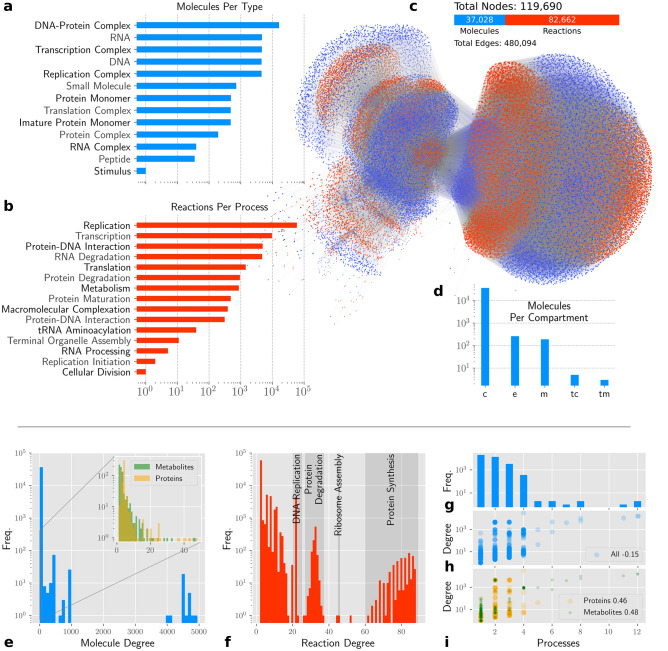
The M. genitalium whole-cell biochemical network an topological analysis. a number of molecules per functional group in logarithmic scale. b Number of reactions per cellular process in logarithmic scale. c Graphical visualization of the M. genitalium whole-cell network. Edges with high associated stoichiometry (over 100) are hidden for better visualization. The big circular group on the right is mainly composed by DNA-Protein complexes and their respective formation reactions. d Number of molecules per compartment in logarithmic scale. e Degree distribution of molecule nodes. The subgraph in the figure is the same degree distribution but showing only the protein and metabolite subgroups of nodes. f Degree distribution for reaction nodes where de degree is the number of connections solely. g Distribution of number of processes a given molecule node participates. h Spearman correlation between node degree and number of processes for all molecule nodes. i Spearman correlation between node degree and number of processes for only proteins and metabolites.

