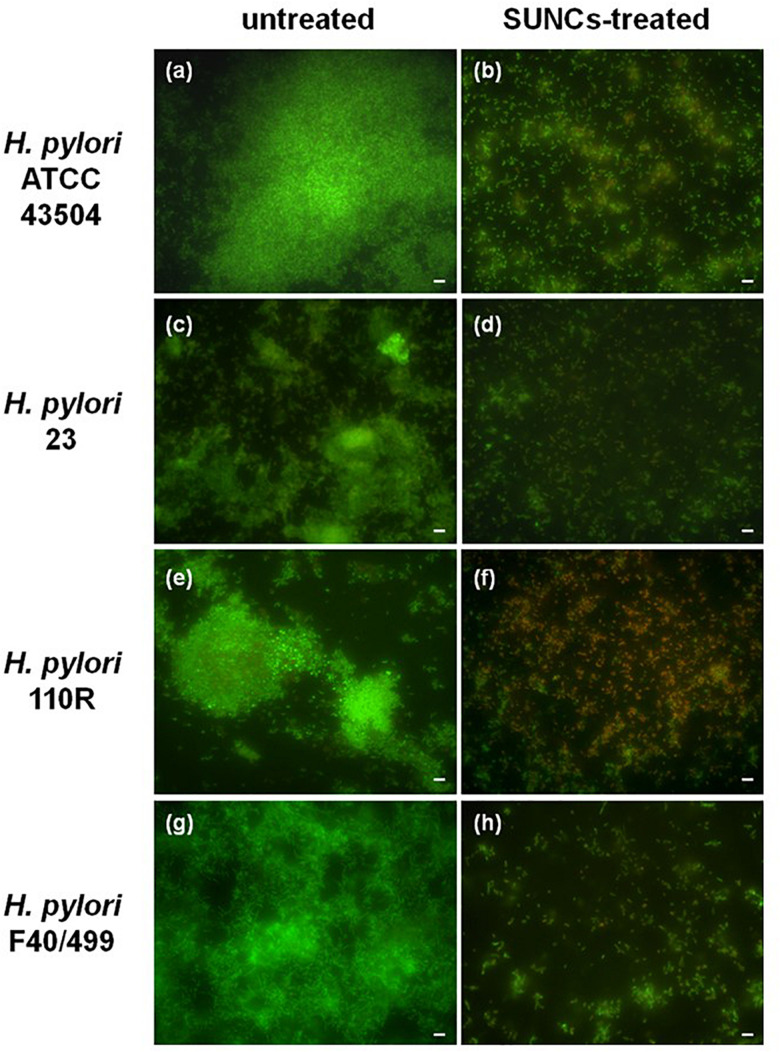
FIGURE 5.
Representative H. pylori biofilms stained with Live/Dead kit and analyzed using fluorescence microscopy. The green fluorescence indicates the live cells, whereas the red fluorescence indicates the dead cells or cells with a damaged cell wall. Panels (a,c,e,g) show the untreated H. pylori biofilms, while panels (b,d,f,h) show H. pylori biofilms treated with SUNCs at MBEC concentrations of 1.28 mg/L for H. pylori strains ATCC 43504 and 23, 0.96 mg/L for 110 R, and 0.64 mg/L for F40/499. Scale bar: 5 μm.

