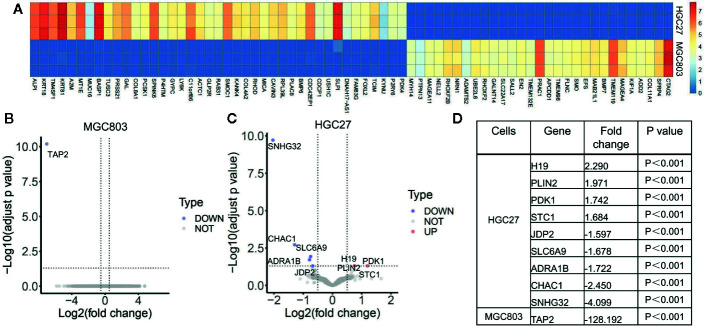
Figure 2.
The effect of serine on global transcriptomic profiles of MGC803 and HGC27 cells. (A) Image of hierarchical clustering analysis for basal expression profiles of MGC803 and HGC27 cancer cells. The heatmap is presented by the FPKM of each differential gene. Row represents experimental cells, and column represents genes. The up-regulated genes are marked by light red color, and down-regulated genes are marked by dark blue color. (B, C) The volcano plots of differential gene expression of MGC803 cells and HGC27 cells in high serine group and standard medium group. (D) The fold change of differential genes in MGC803 and HGC27 cells. These data are representative examples taken from one of the three experiments.

