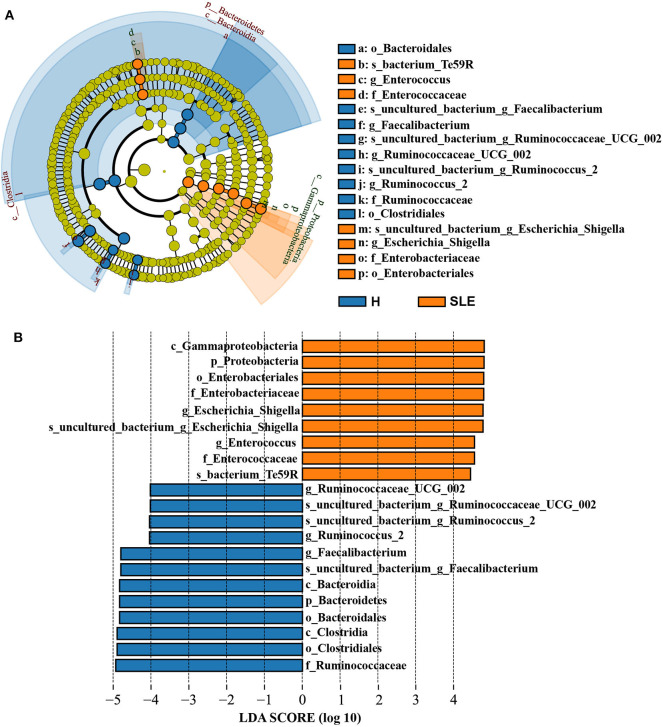
Figure 2.
Linear discriminant analysis (LDA) Effect size analysis. (A) Cladogram of LEfSe linear discriminant analysis of microbiome from 16S rDNA sequencing of Control and SLE patients. Orange and blue circles represent the differences of the most abundant microbiome class. The diameter of each circle is proportional to the relative abundance of the taxon. (B) Histogram of the LDA scores for different abundant genera in healthy control and SLE patients. Orange, enriched in SLE patients; Blue, enriched in healthy controls.

