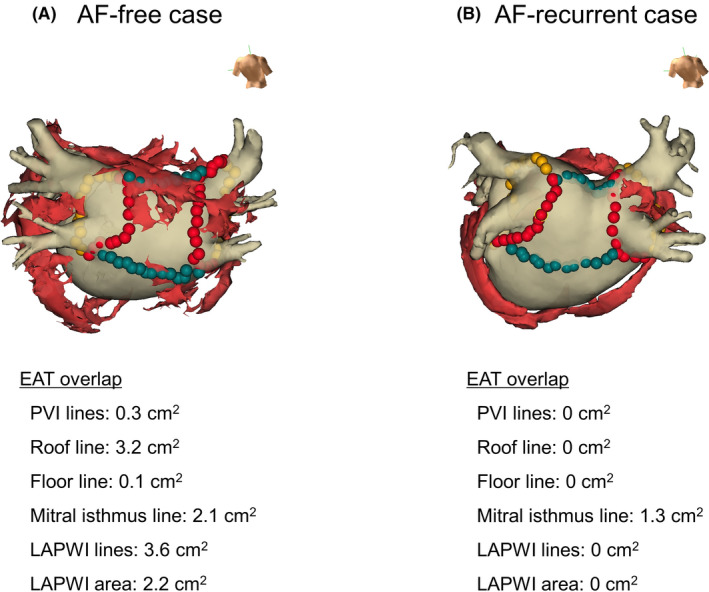
Figure 1.

Representative cases of epicardial adipose tissue (EAT) overlap on ablation lines and the left atrial posterior wall isolation (LAPWI) area. Fusion of the computed tomographic image with EAT (red structures) and the geometry created on three‐dimensional mapping was performed. The red and green tags show the ablation points for pulmonary vein isolation (PVI) and LAPWI respectively. (A) Atrial fibrillation (AF)‐free case. The EAT overlap on LAPWI lines and LAPWI area were 3.6 and 2.2 cm2 respectively. (B) AF‐recurrent case. The EAT overlap on LAPWI lines and LAPWI area were both 0 cm2
