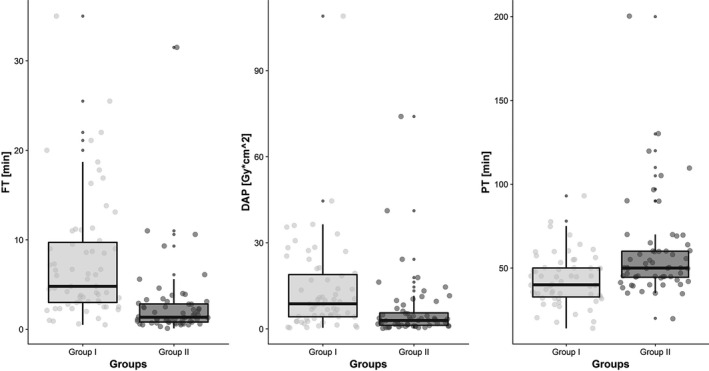
FIGURE 1.

The Box and Whisker Plots show the trends in the median values of Fluoroscopy Time (FT), expressed in minutes [min], Dose Area Product (DAP), expressed in [Gy*cm2], and Procedure Time (PT), expressed in minutes [min]

The Box and Whisker Plots show the trends in the median values of Fluoroscopy Time (FT), expressed in minutes [min], Dose Area Product (DAP), expressed in [Gy*cm2], and Procedure Time (PT), expressed in minutes [min]