FIGURE 2.

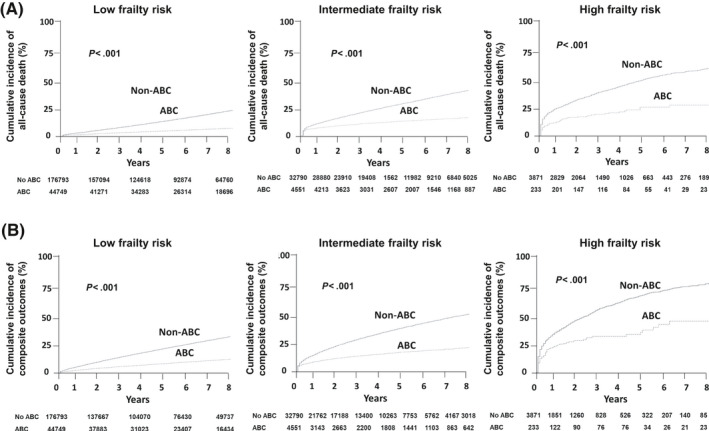
Cumulative incidences of all‐cause death (A) and composite outcomes (B) according to the use of integrated care (ABC) in patients with low (left panels), intermediate (mid panels), and high frailty risk (right panels)

Cumulative incidences of all‐cause death (A) and composite outcomes (B) according to the use of integrated care (ABC) in patients with low (left panels), intermediate (mid panels), and high frailty risk (right panels)