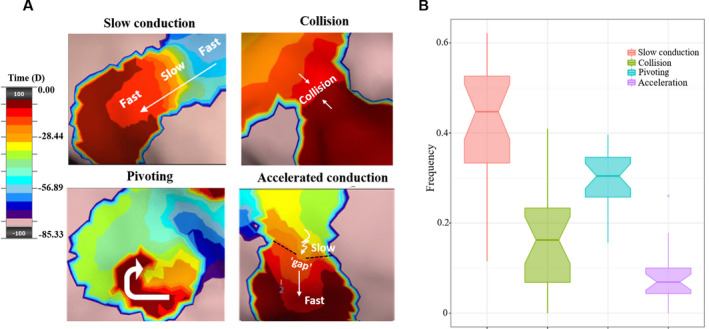
FIGURE 5.

Proportion of four components of localized irregular activation. Panels A shows the four components of localized irregular activation (LIA). The propagation map is color coded using the standard “thermal” scale to represent a “windowed‐history” of activation time across the endocardium with the leading edge of the wavefront shown in maroon. The box plots in Panel B illustrate the proportion of each component of LIA observed. The x‐axis denotes four types of components; the y‐axis denotes the percentage of each component in all cases
