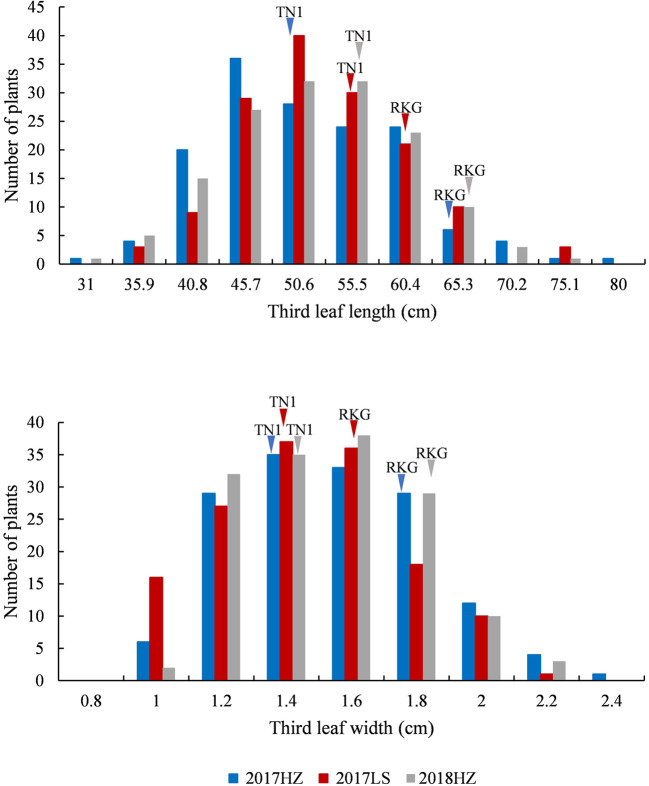
Figure 4.
The frequency distribution of third leaf length and width. The x-axis indicates leaf length and leaf width value planted in Lingshui Hainan (LS) in 2017, and Hangzhou Zhejiang (HZ) in 2017 and 2018. The left y-axis indicates the number of individuals, the phenotypic values of the parents (TN1 and RKG) are pointed by arrows, respectively.

