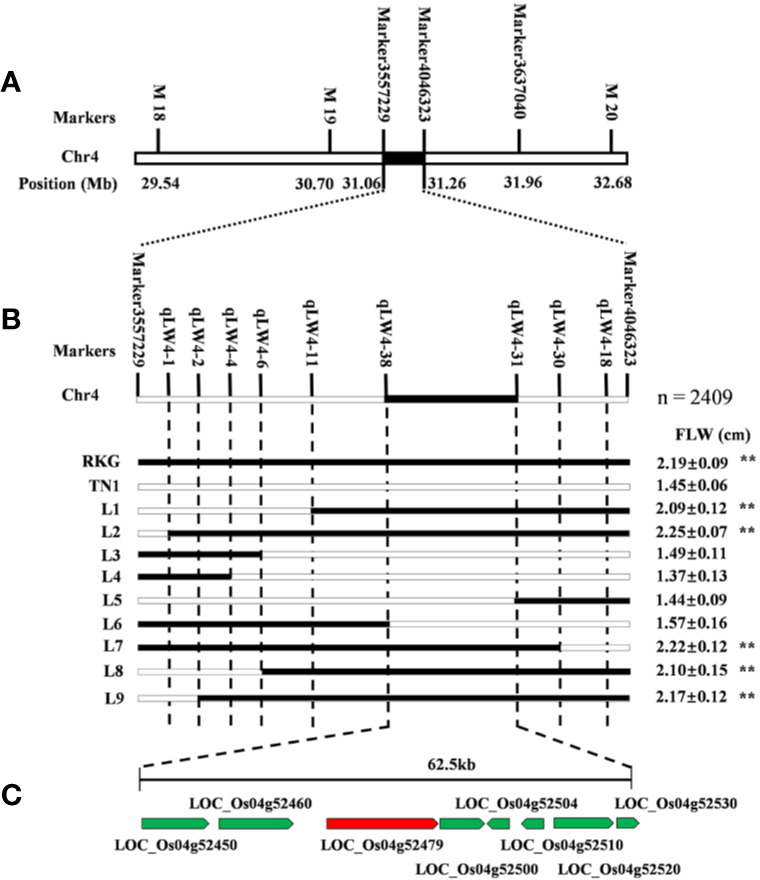
Figure 6.

Fine mapping of qTLW4. (A) Primary map of qTLW4. qTLW4 was primarily located into 194.2 kb. (B) Fine-scale map of qTLW4. Black and white rectangles indicates homozygous genotype regions for Rekuangeng (RKG) and TN1, respectively. The leave width of corresponding recombinant plants, ** indicates a significant difference (P < 0.01) compared to TN1 by the Student’s t-test. (C) Total eight annotated open reading frames were predicted in the 62.5 kb region.
