FIGURE 2.
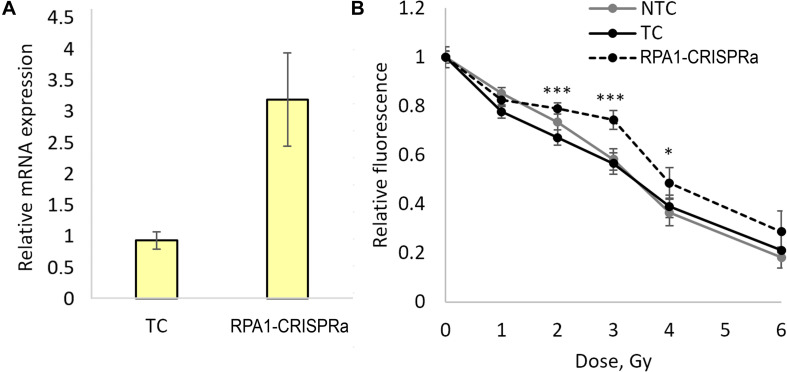
Overexpression of the RPA1 gene detected using qRT-PCR (three samples analyzed per group) (A) and cell viability 72 h after exposure to γ-radiation at 1, 2, 3, 4, and 6 Gy analyzed using the FMCA (B). Average values for 24 microcultures per data point are presented. Relative fluorescence is proportional to the number of live cells in the microculture. *, differences with the TC group are significant at p < 0.05, *** at p < 0.001 (Student’s t-test with the Bonferroni correction).

