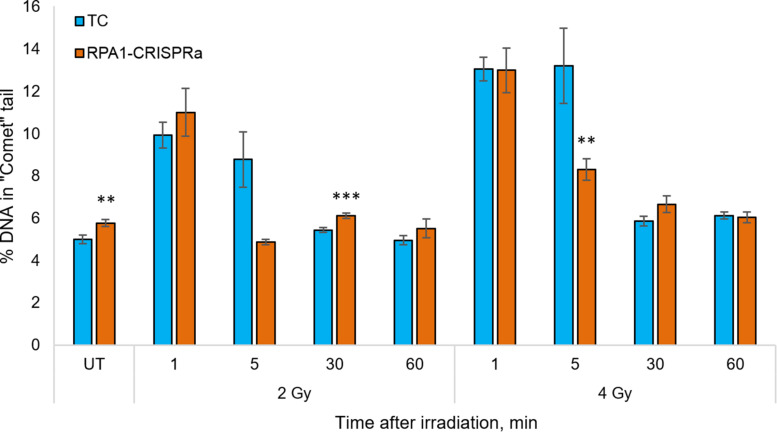
FIGURE 3.
The level of DNA damage in HEK293T cells at 1, 5, 30, and 60 min after irradiation with 2 and 4 Gy. The median value from more than 100 cells per slide were calculated and the mean per nine slides is presented for each group/time point. ** and *** denote statistically significant difference vs. the TC group at p < 0.01 and 0.001, respectively (Student’s t-test).

