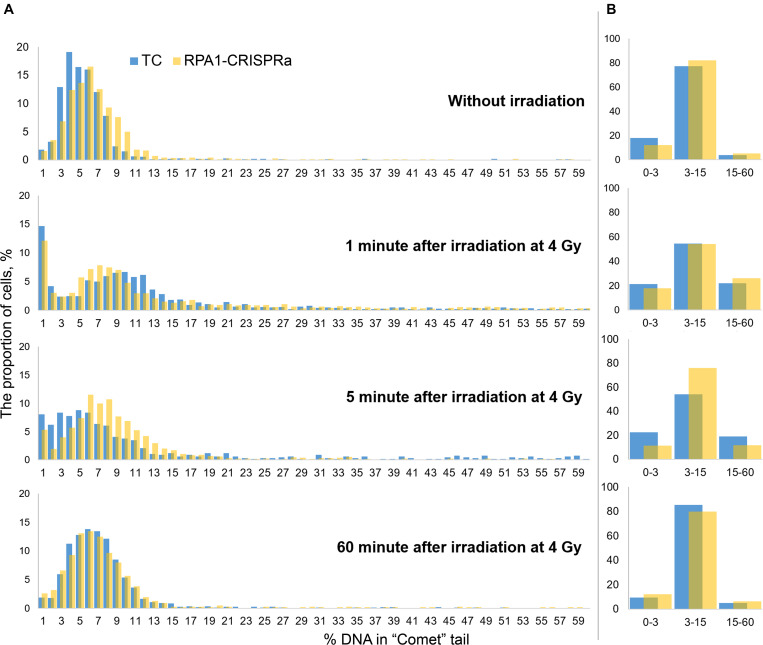
FIGURE 4.
Histograms of the distribution of DNA damage at various time points after irradiation. Cells were pooled either into 1% increments of %DNA in tail (A) for detailed histograms or into three categories of low (1–3 %DNA), intermediate (3–15 %DNA) and high (15–60 %DNA) level of electrophoretic mobility (B). In (A), all nucleoids were analyzed per group. The nucleoids with %DNA more than 60 were not used in the analysis.

