
Figure 8.
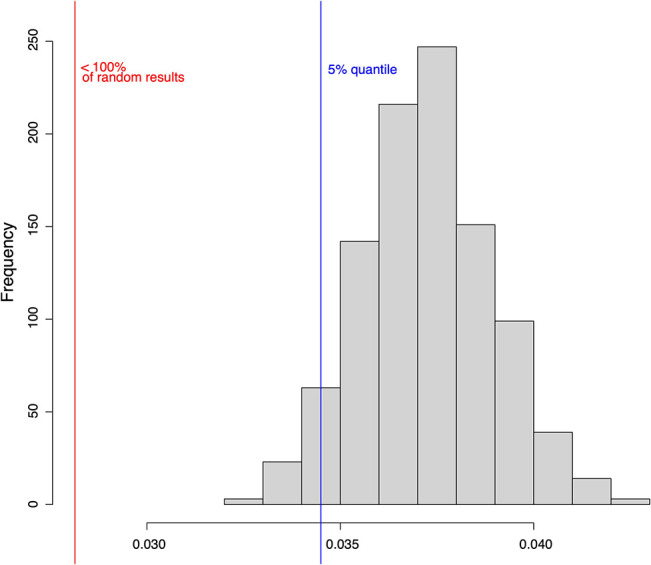
One thousand randomly drawn states of the HSC model were mutated by bit flip and their successor states were computed. The successor states of the mutated and the original states were then compared using the normalized Hamming distance (red line). The same analysis was performed for 1,000 randomly generated networks of the same size (histogram). The blue line shows the 5% quantile.