
FIGURE 5.
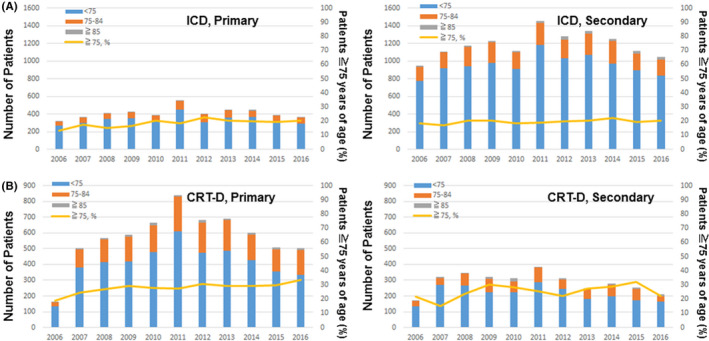
Age‐stratified CIED implant trends in primary prevention and secondary prevention for sudden cardiac death. Implantation trends in three patient groups, aged <75 y (blue bar), aged 75‐84 y (orange bar) and aged ≧85 y (gray bar), and the percentage of patients aged ≧75 y (yellow line) are given for primary prevention (left) and secondary prevention (right) ICD (A) and CRT‐D (B) implantation. The percentage of patients aged ≧75 y increased significantly only in primary prevention CRT‐D implantation (left panel in B, P = .012). The increase in the percentage of patients aged ≧75 y was marginal in primary prevention ICD implantation (left panel in A, P = .059).