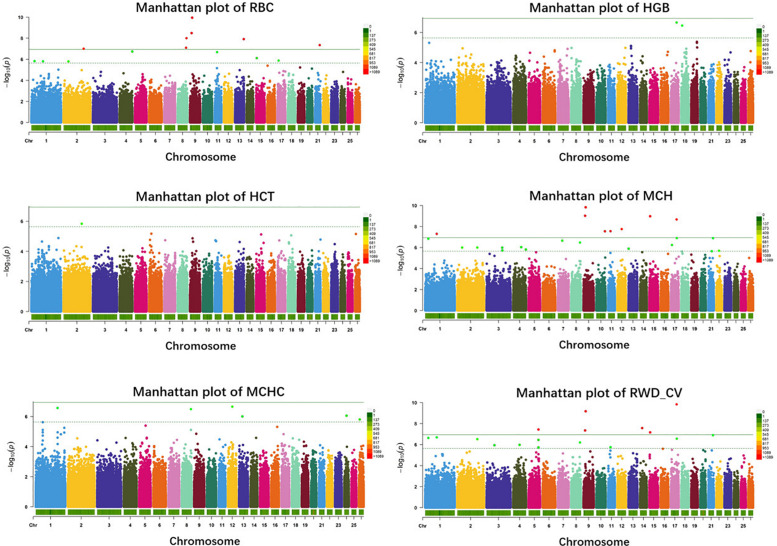
FIGURE 2.
Manhattan plots of single-marker analysis for six erythrocyte traits. Chromosomes 1 to 26 are shown in different colors; the horizontal dotted green line and solid line indicate the suggestive and genome-wide significance level, respectively. Single-nucleotide polymorphisms (SNPs) surpassing the genome-wide threshold are highlighted in red, and SNPs reaching the suggestive threshold are highlighted in green. The strips below each chromosome indicate the density of the markers. The six traits were: red blood cell count (RBC), hemoglobin (HGB), hematocrit (HCT), mean corpuscular hemoglobin (MCH), mean corpuscular hemoglobin concentration (MCHC), and RBC volume distribution width coefficient of variation (RWD_CV).

