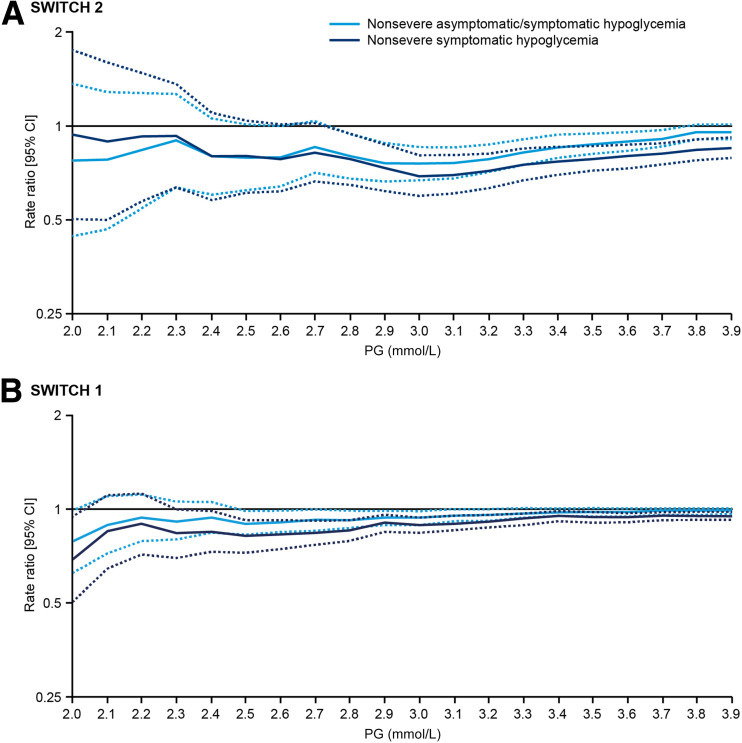
Figure 2.
Estimated rate ratios of nonsevere hypoglycemic events (total and symptomatic; degludec vs. glargine U100) in the maintenance period of SWITCH 2 (A) and 1 (B) at different PG levels. The solid lines represent the estimated rate ratio (degludec vs. glargine U100) at different PG levels. The dashed lines represent the upper and lower 95% CIs.

