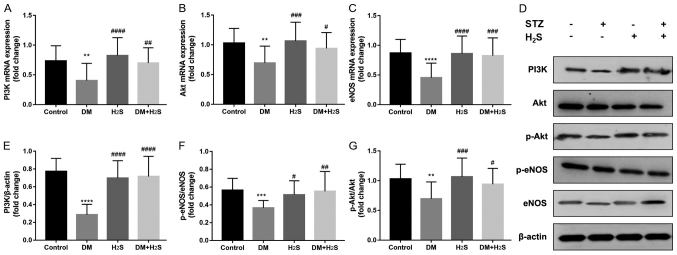
Figure 4.
PI3k/Akt/eNOS pathway expression. (A) PI3K mRNA expression from atrium tissue normalized to β-actin. (B) Akt mRNA expression from atrium tissue normalized to β-actin. (C) eNOS mRNA expression from atrium tissue normalized to β-actin. (D) Representative western blotting bands of PI3K/Akt/eNOS pathway proteins. (E) PI3K protein expression level normalized to β-actin. (F) p-Akt/Akt protein level ratio. (G) p-eNOS/eNOS protein level ratio. n=20 for each group. Data are presented as mean ± SD. **P<0.01, ***P<0.001 and ****P<0.0001 vs. the control group; #P<0.05, ##P<0.01, ###P<0.001 and ####P<0.0001 vs. the DM group. Fold-change indicates the value compared with the control group. p-, phosphorylated; eNOS, endothelial NOS; DM, diabetes mellitus; H2S, hydrogen sulfide; STZ, streptozotocin.

