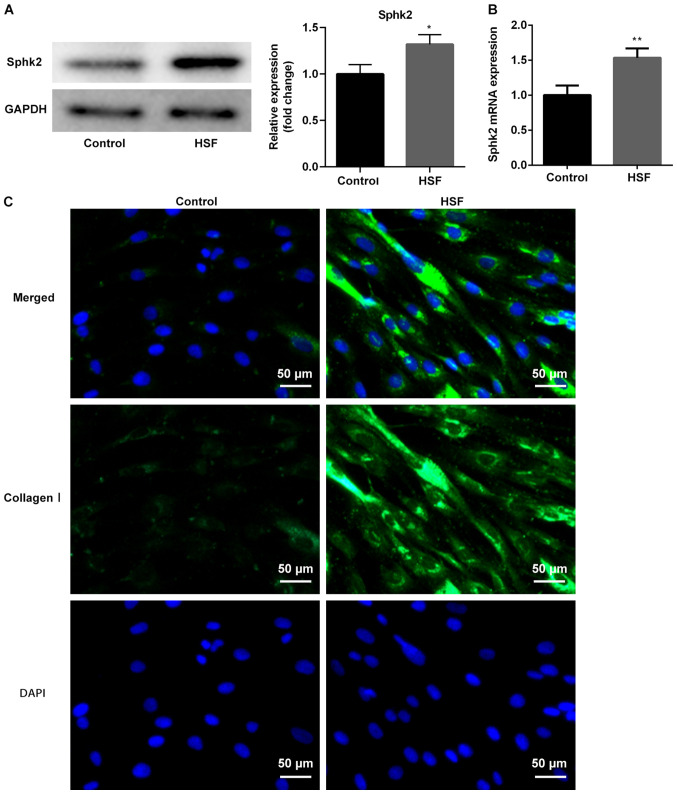
Figure 2.
Expression levels of Sphk2 and collagen I are upregulated in HSF compared with the control group. (A) Western blotting and (B) reverse transcription-quantitative PCR were used to assess the protein and mRNA expression levels of Sphk2, respectively. (C) Expression of collagen I was detected using immunofluorescence assay. Scale bar, 50 µm. All experiments were repeated three times independently. Data are presented as the mean ± SD. *P<0.05, **P<0.01 vs. the control. Sphk2, sphingosine kinase 2; HSF, hypertrophic scar fibroblasts.

