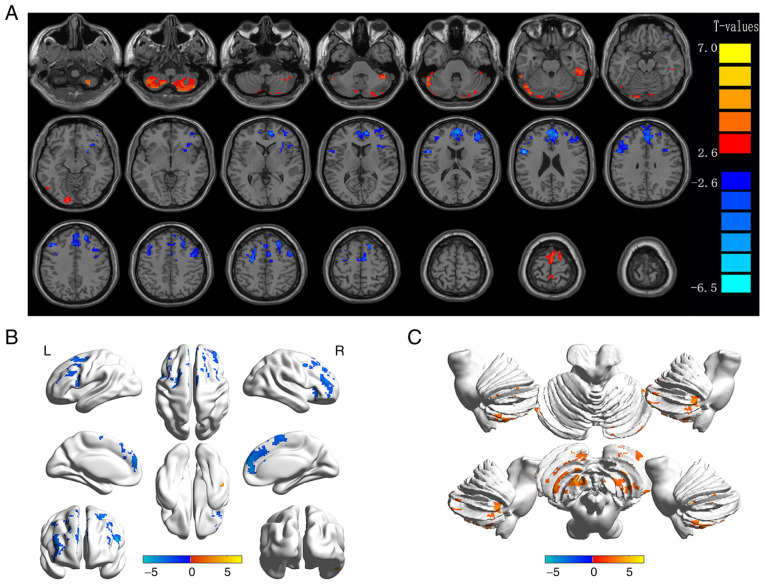
Figure 2.
Spontaneous brain activity in diabetic patients with VH vs. NCs. (A) Different ALFF regions between the VH and NC groups. (B) Differences of brain activity in the cerebrum. (C) Differences of brain activity in the cerebellum. Compared with HC, red represents the brain areas with increased ALFF, and blue represents the brain areas with decreased ALFF in patients with VH. P<0.01 for multiple comparisons using Gaussian Random Field theory (AlphaSim corrected; cluster >40 voxels; P<0.01). ALFF, amplitude of low-frequency fluctuation; VH, vitreous hemorrhage; NCs, normal controls; R, right; L, left.

