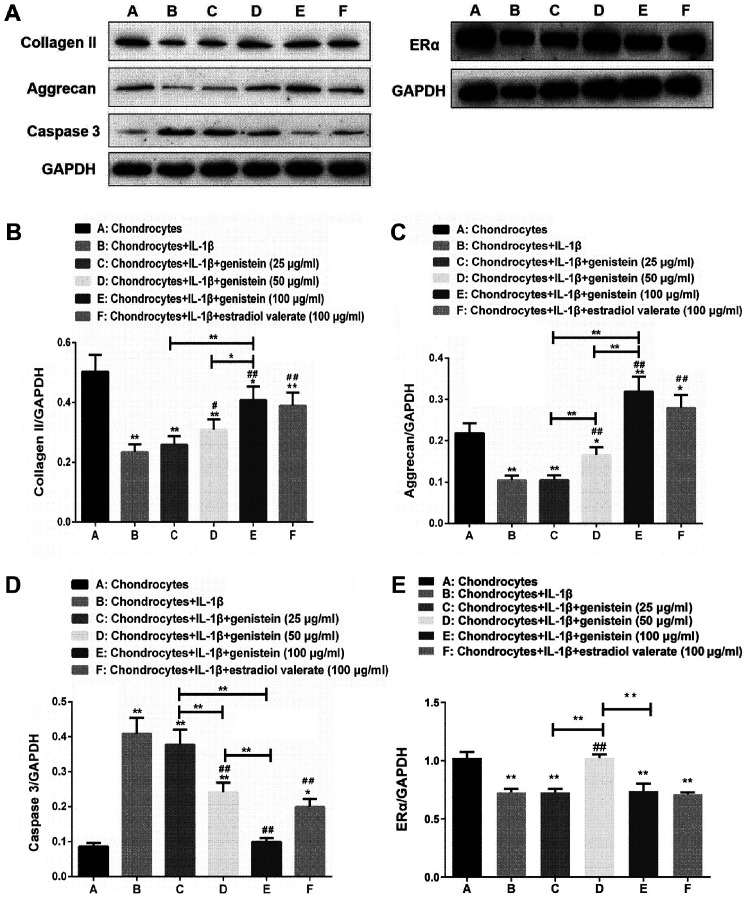
Figure 2.
Protein expression levels of collagen II and aggrecan increase with the added concentration of genistein, while caspase 3 protein levels gradually decrease in each group. (A) Western blot analysis of samples from the experimental groups were tested with the indicated antibodies. (B) Semi-quantitative analyses of collagen II/GAPDH, (C) aggrecan/GAPDH, (D) caspase 3/GAPDH and (E) ERα/GAPDH ratios. Data are presented as the mean ± SD (n=10). *P<0.05, **P<0.01 vs. group A or as indicated; #P<0.05, ##P<0.01 vs. group B. ERα, estrogen receptor α.

